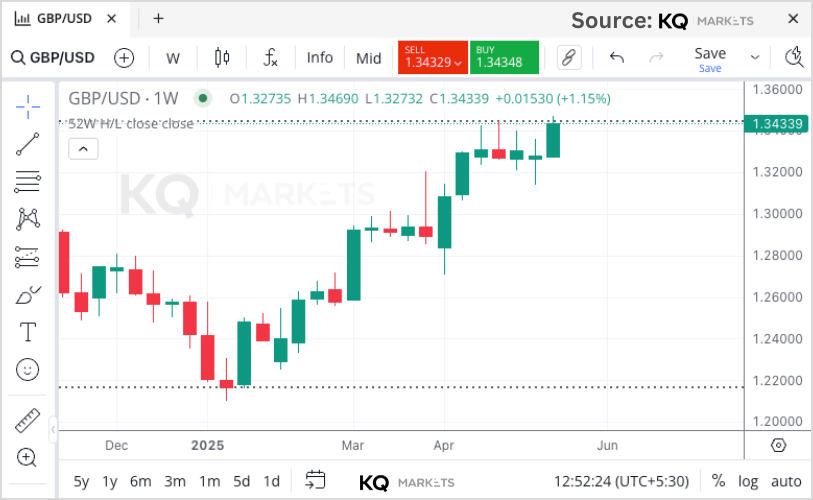
- The GBP/USD exchange rate has shown a remarkable upward trend in recent sessions. As of Wednesday morning, it is trading at 1.3430, nearing key resistance levels.
- Traders are keenly observing this movement as it approaches levels not seen since early 2022.
- In this article, we will look at the main factors that affect the GBP/USD price forecast. We will also examine important support and resistance levels.
- Stay tuned for insights that can help you navigate this fluctuating market.
The GBP/USD exchange rate is up for the third consecutive session, continuing its upward trend. The pair is trading at 1.3430 on Wednesday morning. It is nearing the important resistance level of 1.3445. This level was last seen in February 2022.
What’s Driving the Rise?
On the daily chart, the pair stays inside a distinct upward channel, indicating continued bullish sentiment. GBP/USD is trading above the nine-day Exponential Moving Average (EMA). This EMA is acting as a support zone and shows short-term price strength.
The current bullish trend is supported by the 14-day Relative Strength Index (RSI), which is above 50. Traders are watching price action closely. These technical indicators show strong buying interest.
Key Levels to Watch
- Immediate Resistance: 1.3445 is the next important resistance. A break above this level could lead to more gains toward the upper boundary of the ascending channel, near 1.3890.
- Short-Term Support: The nine-day EMA sitting at 1.3339 serves as the initial support level for any downward movements.
- The channel's lower boundary at 1.3270 would be the next target if this level were to be broken.
- Additional Support Zones: The 50-day EMA at 1.3147 serves as a crucial support, and a clear move below 1.3270 could change momentum. Prices might then test the monthly low at 1.2708 or even go back to the two-month low at 1.2577.
Outlook for Traders
The outlook is still bullish as long as the GBP/USD exchange rate stays above the major moving averages and inside the ascending channel. Traders should be careful when they reach resistance levels. They should watch for signs of a reversal, especially if the price drops below 1.3270.
Market players should keep an eye on general economic data and geopolitical events. These factors could impact the strength of the GBP or USD.
Conclusion: What GBP/USD Movements Mean for Traders
Traders should closely watch important technical indicators and economic factors. The GBP/USD is nearing levels not seen since early 2022. This currency pair offers chances and risks for forex traders. Short-term momentum is strong, and resistance levels are being tested.
At KQ Markets, we are dedicated to giving you current insights on foreign exchange trends. We also cover global economic factors and technical trading indicators that affect trading strategies. No matter what you are trading, it's important to understand GBP/USD movements. This includes currency pairs, CFDs, and other financial products. This knowledge is crucial for making well-informed and sensible trading decisions in the ever-changing market landscape.
Stay ahead of currency trends with KQ Markets. Register now to access professional insights and improve your trading approach.