CFDs and Spread bets are complex instruments and come with a high risk of losing money rapidly due to leverage. 75% of retail investor accounts lose money when trading CFDs and Spread bets with this provider. You should consider whether you understand how CFDs and Spread bets work and whether you can afford to take the high risk of losing your money.
75% of retail investor accounts lose money when trading CFDs and Spread bets with this provider.
Dow Jones, Nasdaq & S&P 500: The Support & Resistance Levels You Need to Know
Posted by: KQ Analyist 04-Sep-2025
Share on:
Article /
Dow Jones, Nasdaq & S&P 500: The Support & Resistance Levels You Need to Know
For traders, daily headlines are often just noise. The real opportunity lies in understanding the key technical levels that define the market's boundaries. Here are the critical support and resistance levels for the major US indices that could dictate the market's direction for the remainder of the week.
The current market dynamic is a perfect example of why technical analysis is so crucial. With recent US data signalling a cooling economy, market sentiment has turned bullish, increasing the possibility of a Fed rate cut. Yet, the price action on the charts is what ultimately matters. Trading is about strategy, not speculation, and a firm grasp of technical levels is a core component of that strategy.
At KQ Markets, we empower our clients with the tools and insights to execute their trading plans with precision. Understanding these key levels is your first step.
The Levels That Matter: Your Trading Blueprint
This is not a forecast, but a map for navigation. The following levels represent pivotal points where price action is likely to encounter significant buying or selling pressure.
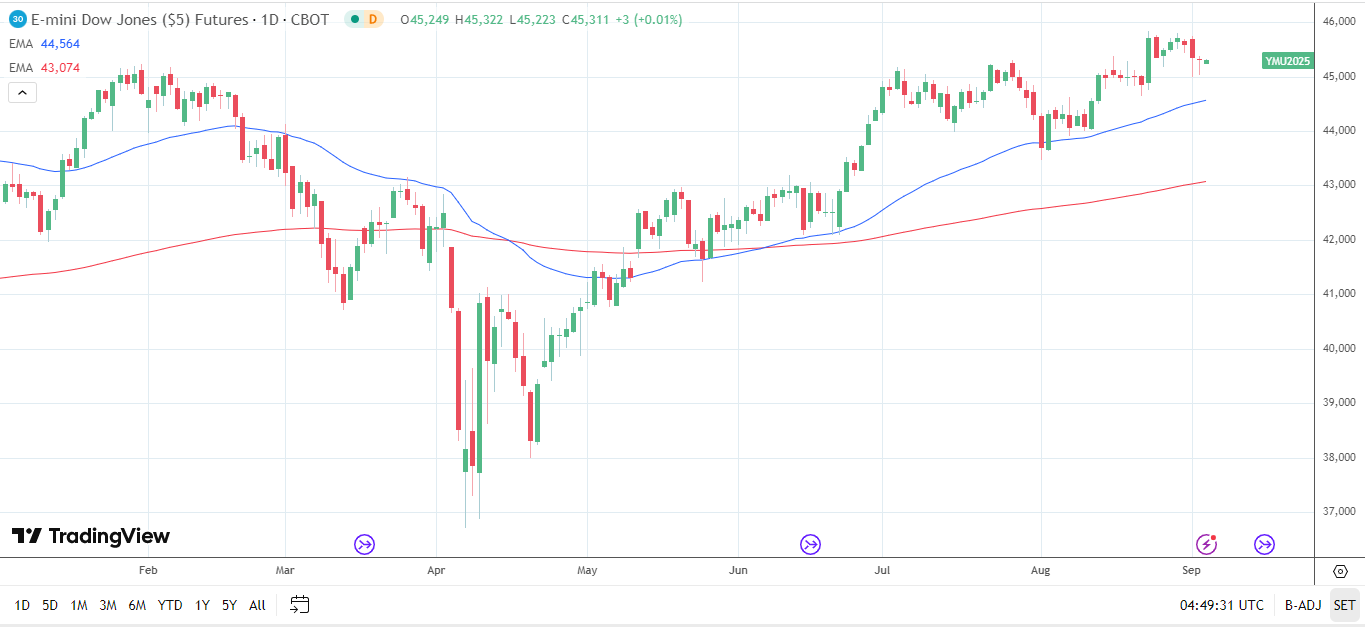
Dow Jones:
Resistance: The primary resistance point is the August 22 high of 45,841. A break and close above this level could signal a continuation of the bullish trend, with the next targets at 46,000 and 46,500.
Support: Look for a strong floor at 45,000. If this level fails, the 50-day Exponential Moving Average (EMA) at 44,564 will serve as the next critical line of defense for the bulls.
Dow Jones – Daily Chart – 4 Sep.2025
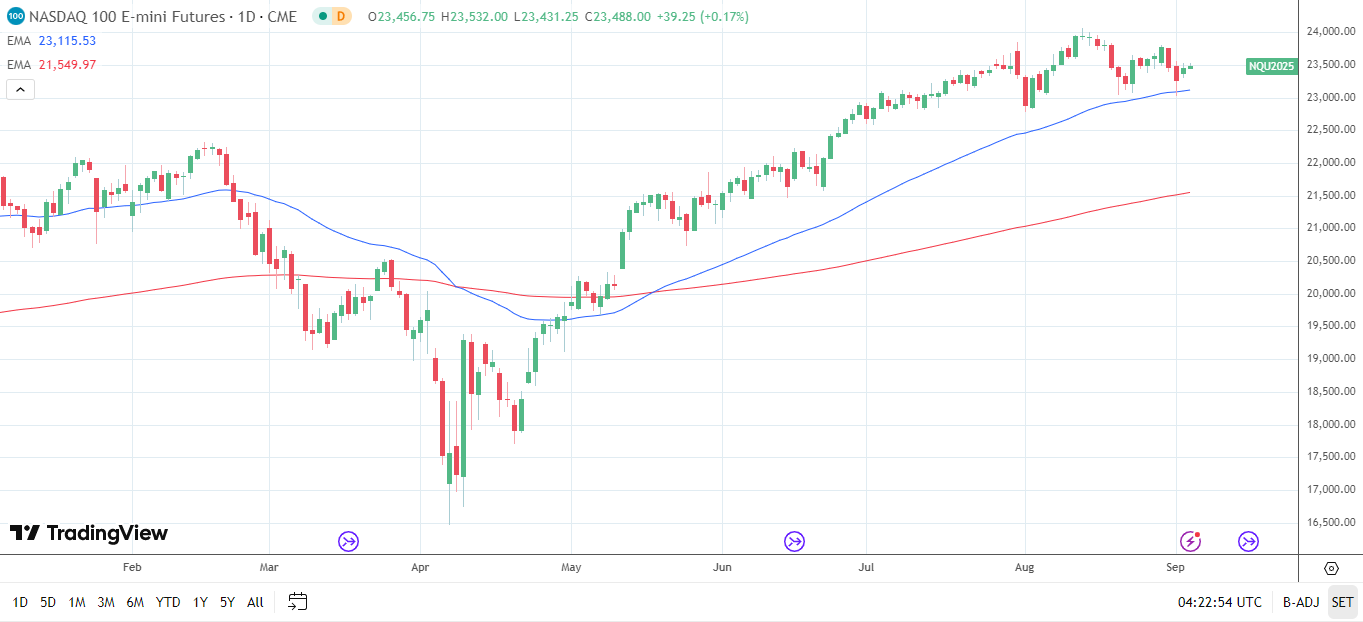
Nasdaq 100:
Resistance: The key hurdle for the Nasdaq is the August 18 high of 23,882. A breakout could pave the way for a run towards 24,000 and potentially 24,500.
Support: The first major support is the 50-day EMA at 23,116. A dip below this would bring the psychological level of 23,000 into focus.
Nasdaq 100 – Daily Chart – 4 Sep.2025
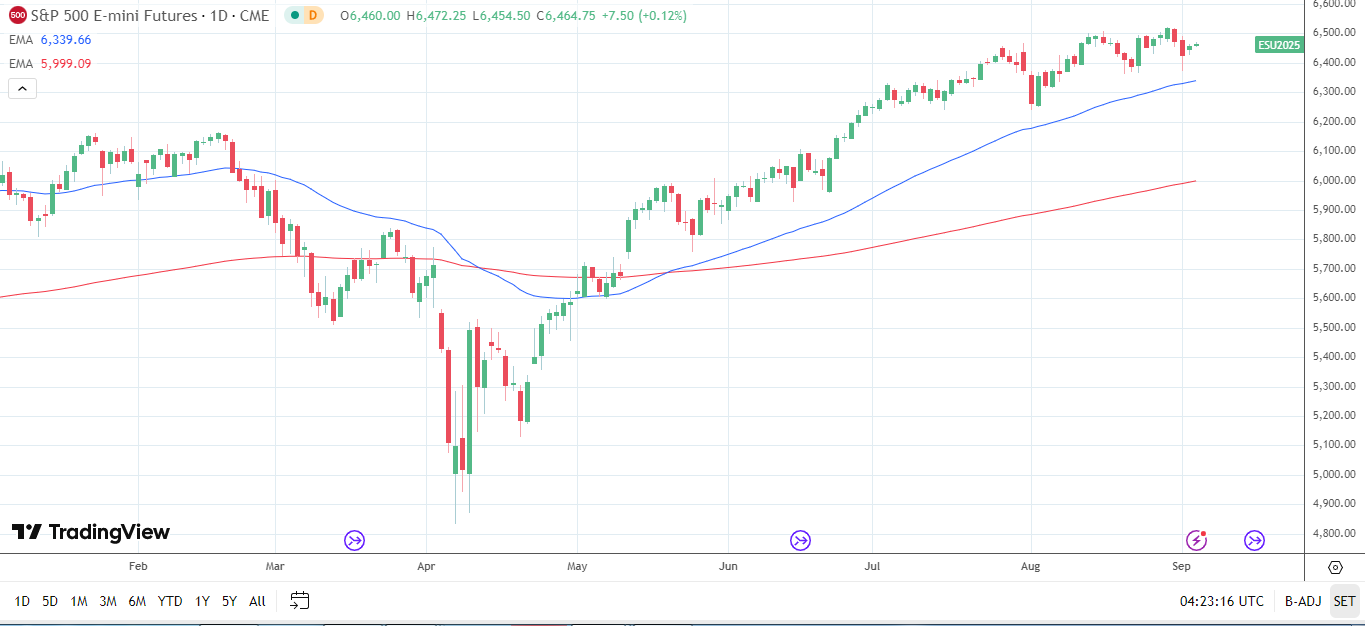
S&P 500:
Resistance: The main resistance to watch is the August 28 high of 6,523. A clear move past this point could signal further upside towards 6,750.
Support: The immediate support is at 6,400. Below this, the 50-day EMA at 6,340 becomes a crucial level for a potential bounce.
S&P 500 – Daily Chart – 4 Sep.2025
These are the levels that experienced traders use to set their stop-losses, identify entry points, and manage their risk. . To learn more about how to use these concepts in practice, explore our guides on technical indicators and watch our beginner's trading videos.
Don't just watch the market—trade it. Open a KQ Markets Account now and use our professional platforms to execute your strategy.
Navigating with Expert Tools
Trading these key support and resistance levels requires an advanced platform. At KQ Markets, our platforms, including our trading apps, provide the real-time data, lightning-fast execution, and deep market analysis tools necessary to capitalize on these pivotal moments.
Whether you are interested in trading the major indices or looking to trade shares and other assets, we have a market for you. Our economic calendar will keep you ahead of the data releases that could trigger a breakout or a reversal.