CFDs and Spread bets are complex instruments and come with a high risk of losing money rapidly due to leverage. 75% of retail investor accounts lose money when trading CFDs and Spread bets with this provider. You should consider whether you understand how CFDs and Spread bets work and whether you can afford to take the high risk of losing your money.
75% of retail investor accounts lose money when trading CFDs and Spread bets with this provider.
Fed Bets and Shutdown Jitters: Key Technical Levels for Dow Jones, Nasdaq & S&P 500
Posted by: KQ Markets 02-Oct-2025
Share on:
Article /
Fed Bets and Shutdown Jitters: Key Technical Levels for Dow Jones, Nasdaq & S&P 500
A pivotal week for US markets is unfolding, shaped by a government shutdown and rising bets on a Federal Reserve rate cut. While Asian indices opened higher, US futures are showing signs of divergence. For traders, the spotlight is on the charts — with support and resistance levels providing the clearest blueprint for navigating volatility.
Stock futures are entering Q4 close to record highs, but risks remain elevated. A cautious Federal Reserve, a softening labour market, and political uncertainty in Washington are combining to create an environment where precision matters more than speculation.
Dovish Bets Fuel Tech, While Shutdown Weighs on Sentiment
Recent labour market data has increased the likelihood of a Fed rate cut in October, with the CME FedWatch Tool showing probabilities near 99%. This has bolstered rate-sensitive tech stocks, pushing Nasdaq 100 and S&P 500 futures higher.
However, the ongoing shutdown is dampening confidence in broader markets. The Dow Jones E-mini slipped 12 points, reflecting concerns about stalled negotiations and potential pressure on employment.
Despite this, traders appear to be looking past the long-term impact of shutdowns. Historical data suggests the S&P 500 has delivered an average 13% gain in the 12 months following previous shutdowns. In the short term, though, the suspension of key data releases — such as payrolls and jobless claims — forces traders to rely more heavily on market sentiment and technical analysis.
Technical Map: Critical Support and Resistance
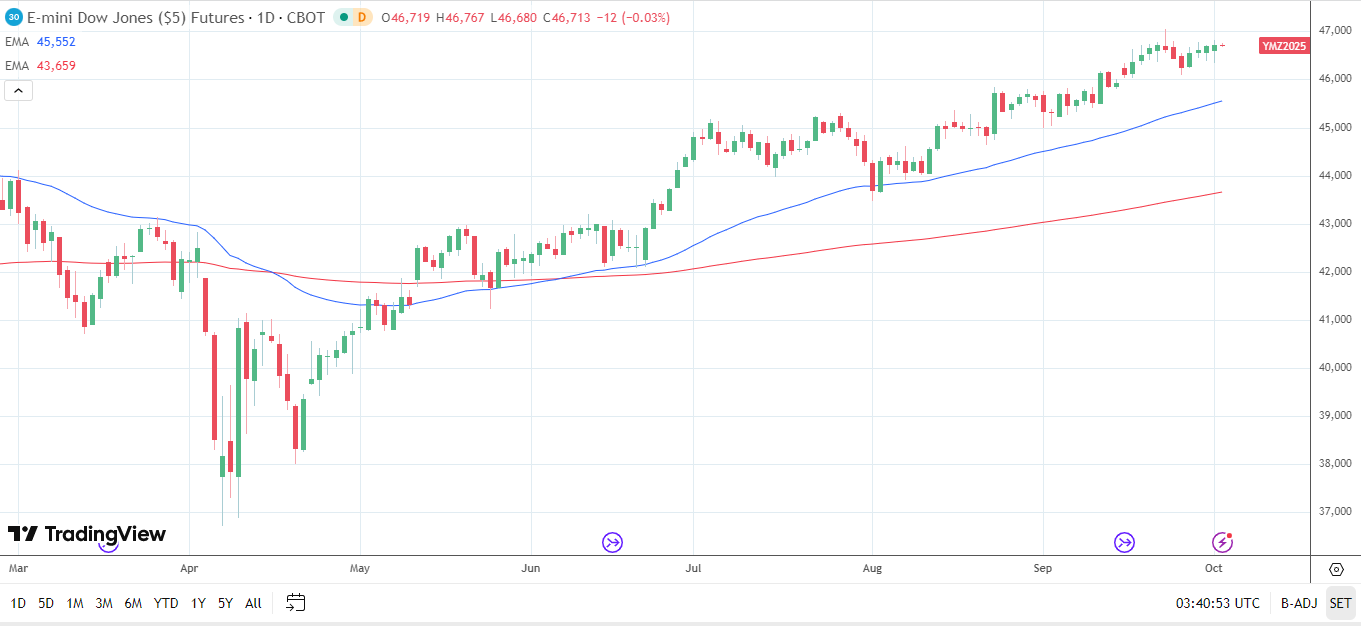
Dow Jones
Resistance: September 23 record high at 47,055. A break here confirms bullish conviction.
Support: 46,500 and 46,000 remain key. The 50-day EMA at 45,552 provides strong underlying support.
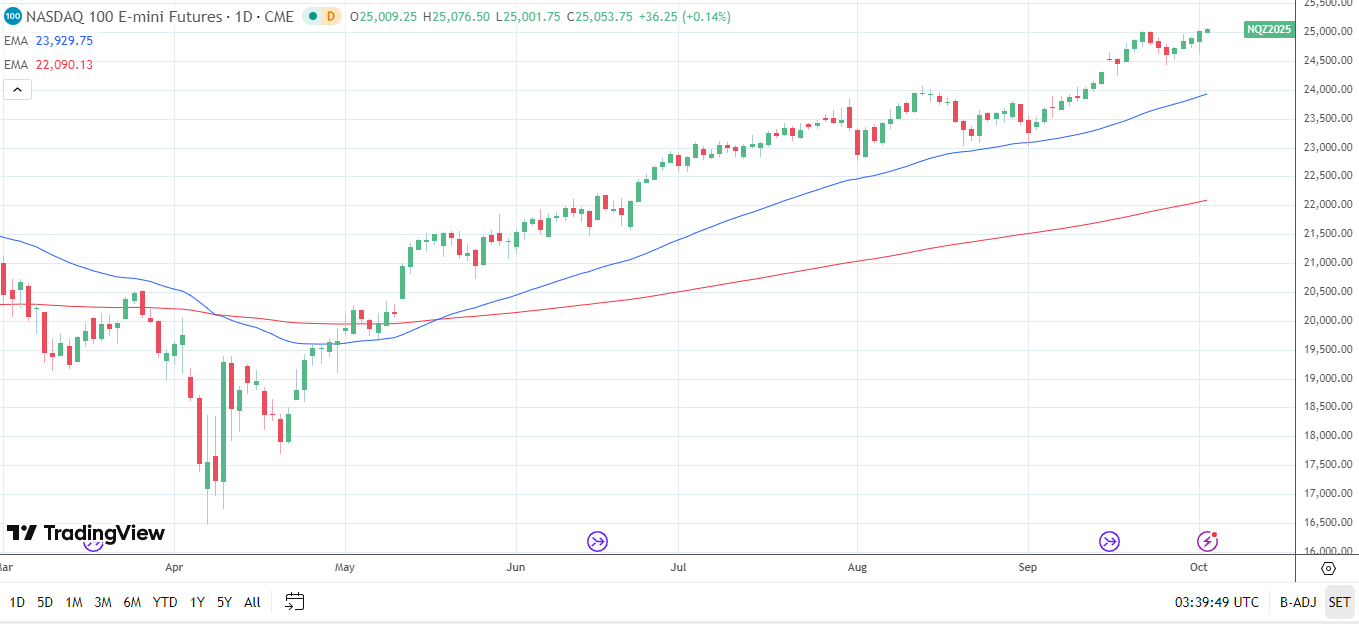
Nasdaq 100
Resistance: October 2 record high at 25,077, with the next target at 25,250.
Support: Levels to watch are 24,500 and 24,000. The 50-day EMA at 23,930 is a crucial dynamic floor.
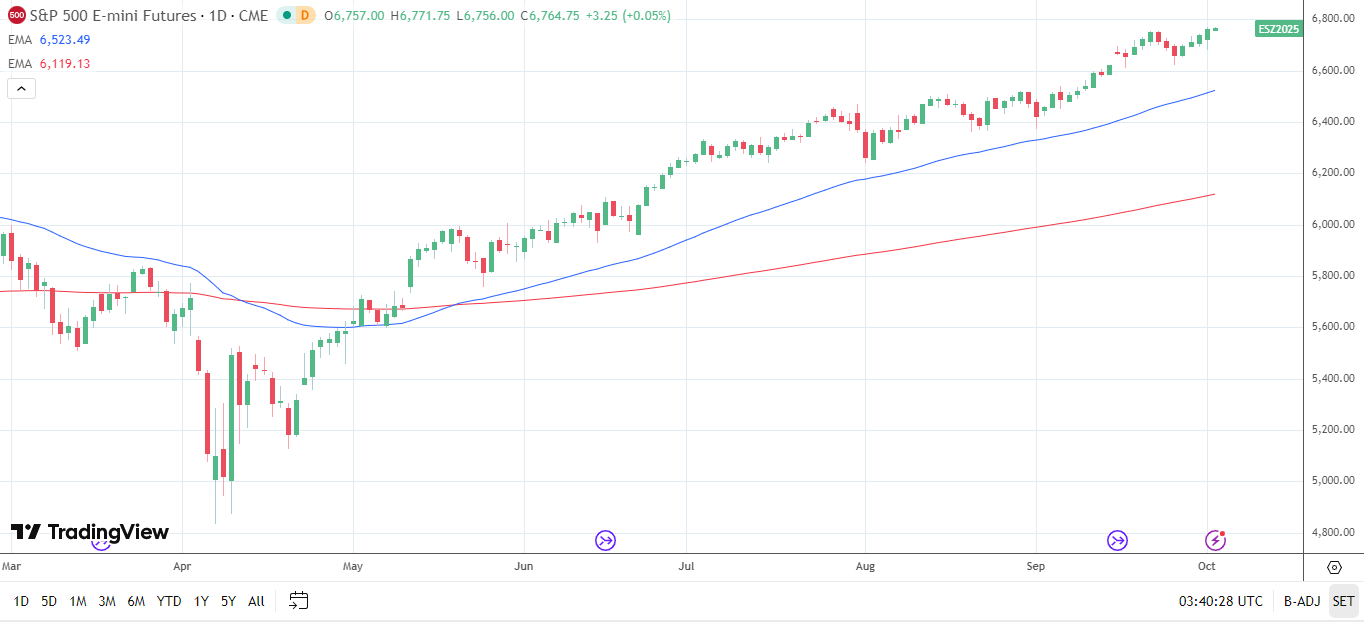
S&P 500
Resistance: October 2 record high of 6,772. Sustained momentum could pave the way for a test of the psychological 7,000 level.
Support: 6,600 is the first key level, followed by the 50-day EMA at 6,524.
All three indices are trading above both their 50-day and 200-day EMAs, maintaining a short-term bullish bias.
What Traders Should Monitor
With economic data releases suspended, the focus now shifts to two external forces:
Capitol Hill Negotiations: A swift resolution could restore confidence, while prolonged stalemates may weigh on equities.
FOMC Commentary: Although the Fed is expected to maintain a dovish stance during the shutdown, any hawkish remarks could temper risk appetite.
At KQ Markets, our platforms provide instant access to global indices, real-time data, and advanced charting tools. Traders can react swiftly to breaking news and manage risk with precision.
Trade Indices with KQ Markets
Whether you’re trading the Dow Jones, Nasdaq, S&P 500, or diversifying into other markets such as Forex, KQ Markets offers the tools you need to stay ahead. Benefit from tight spreads, FCA regulation, and platforms designed for professional execution.